Visualizing Differential Expression Genes
[11]:
import pandas as pd
import matplotlib.pyplot as plt
plt.rcParams['font.family']='sans serif'
plt.rcParams['font.sans-serif']='Arial'
plt.rcParams['pdf.fonttype']=42
import numpy as np
import os
sys.path.append(os.path.expanduser("~/Projects/Github/PyComplexHeatmap/"))
import PyComplexHeatmap
from PyComplexHeatmap import *
[12]:
expr = pd.read_csv("../data/test_expression_datasets.csv",index_col=0)
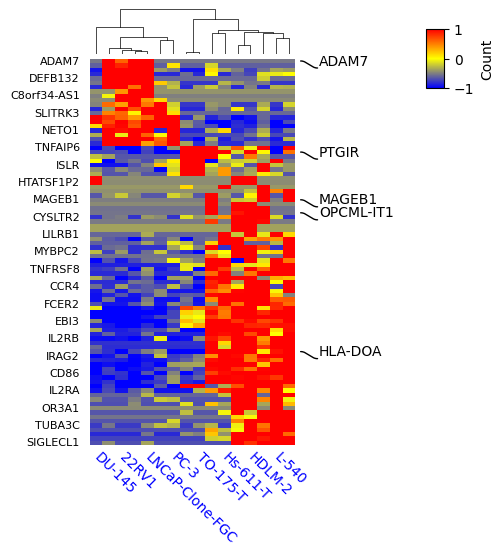
selected_rows = ['ADAM7', 'HLA-DOA', 'PTGIR', 'OPCML-IT1', 'MAGEB1']
label_rows = expr.apply(lambda x:x.name if x.name in selected_rows else None,axis=1)
print(label_rows)
print(expr.shape)
ADAM7          ADAM7
C8orf34-AS1    None
SMIM28         None
LINC01114      None
KLK3           None
               ...
TRAJ45         None
TPMTP1         None
OPCML-IT1      OPCML-IT1
HNRNPCP4       None
MAGEB1         MAGEB1
Length: 89, dtype: object
(89, 16)
[13]:
expr.head()
[13]:
| NCI-H660 | PC-3 | VCaP | DU-145 | MDA-PCa-2b | 22RV1 | LNCaP-Clone-FGC | SUP-HD1 | L-540 | L-1236 | KM-H2 | HDLM-2 | Hs-616-T | L-428 | Hs-611-T | TO-175-T | |
|---|---|---|---|---|---|---|---|---|---|---|---|---|---|---|---|---|
| ADAM7 | -1.000000 | -1.0 | -0.044425 | -1.0 | -0.303654 | -0.604782 | -0.123861 | -1.000000 | -1.000000 | -1.000000 | -1.000000 | -1.000000 | -1.000000 | -1.000000 | -1.0 | -1.0 |
| C8orf34-AS1 | -1.000000 | -1.0 | -0.015847 | -1.0 | -0.848602 | -0.215875 | -0.251406 | -1.000000 | -1.000000 | -1.000000 | -1.000000 | -1.000000 | -1.000000 | -1.000000 | -1.0 | -1.0 |
| SMIM28 | -0.795724 | -1.0 | -0.092080 | -1.0 | -1.000000 | 0.070939 | -0.705117 | -1.000000 | -1.000000 | -1.000000 | -1.000000 | -1.000000 | -1.000000 | -1.000000 | -1.0 | -1.0 |
| LINC01114 | -1.000000 | -1.0 | -0.241584 | -1.0 | -1.000000 | -0.766805 | -0.132841 | -1.000000 | -1.000000 | -1.000000 | -1.000000 | -1.000000 | -1.000000 | -1.000000 | -1.0 | -1.0 |
| KLK3 | -1.000000 | -1.0 | 0.531804 | -1.0 | 1.000000 | 0.564560 | 1.000000 | -0.832337 | -0.442301 | -0.472336 | -0.359856 | -0.911472 | -0.795981 | -0.391838 | -1.0 | -1.0 |
[14]:
row_ha = HeatmapAnnotation(
                            selected=anno_label(label_rows,colors='black'),
                            axis=0,verbose=0,orientation='right'
                            )

plt.figure(figsize=(3, 5))
cm = ClusterMapPlotter(data=expr, z_score=0,
                        right_annotation=row_ha,
                        col_cluster=True,row_cluster=True,
                        label='Count',row_dendrogram=False, col_dendrogram=True,
                        show_rownames=True,show_colnames=True,
                        #plot_legend=False,
                        cmap='exp1',
                        tree_kws={'row_cmap': 'Dark2'},
                        xticklabels_kws={'labelrotation':-45,'labelcolor':'blue'},
                        yticklabels_kws = {'labelsize':8}
                       )
Starting plotting..
Starting calculating row orders..
Reordering rows..
Starting calculating col orders..
Reordering cols..
Plotting matrix..
Collecting legends..
Plotting legends..
[15]:
row_ha.orientation
[15]:
'right'
[16]:
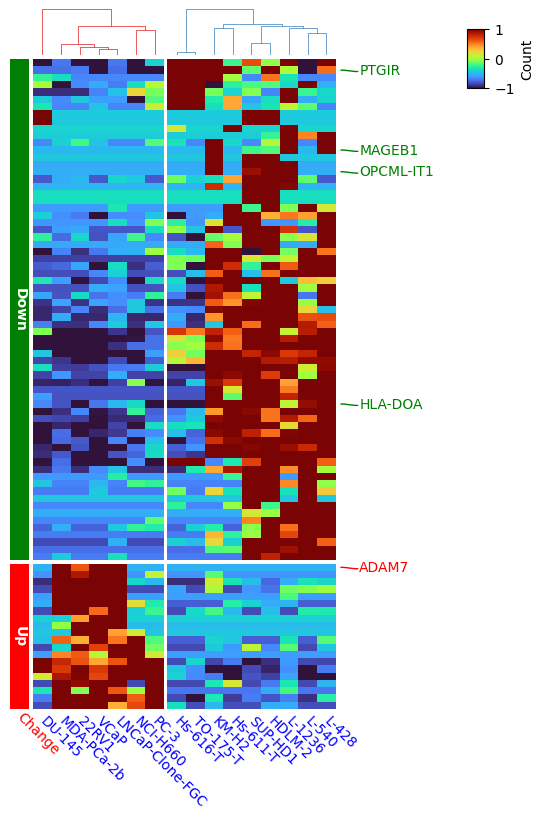
rank2 = pd.DataFrame(index=expr.index, data= ['Up']*20+['Down']*69, columns=['Regulation']) #top20 genes upregulated
print(rank2)

goi= ['ADAM7', 'HLA-DOA',  'PTGIR', 'OPCML-IT1',  'MAGEB1']
colors_dict={}
for g in goi:
    if g=='ADAM7':
        colors_dict[g]='red'
    else:
        colors_dict[g]='green'

label_rows = expr.apply(lambda x:x.name if x.name in goi else None,axis=1)
print(label_rows)
print(expr.shape)


row_ha_left = HeatmapAnnotation(
                            Change =anno_simple(rank2['Regulation'],colors={'Up': 'red', 'Down': 'green'},
                                                add_text=True,legend=False,height=5,
                                                text_kws={'color':'white', 'fontsize':10,'fontweight':'bold',
                                                          'rotation':-90,'horizontalalignment':'left'}),
                            label_kws={'fontsize':10,'color':'red','rotation':-45,'horizontalalignment':'left'},
                            label_side='bottom',axis=0,verbose=0
                            )

row_ha_right = HeatmapAnnotation(
                            selected=anno_label(label_rows, colors=colors_dict,
                                               relpos=(0,0.4)),  #label_side='top',
                            axis=0,verbose=0,
                            #label_kws={'rotation':0,'horizontalalignment':'right','verticalalignment':'top', },
                            orientation='right'
                            )
#plt.show()

plt.figure(figsize=(4.5, 8))
cm = ClusterMapPlotter(data=expr,  z_score=0,
                        right_annotation=row_ha_right, left_annotation=row_ha_left,#
                        col_cluster=True,row_cluster=True,
                        label='Count',row_dendrogram=False,
                        col_dendrogram=True, show_rownames=True,show_colnames=True,
                        cmap='turbo',
                        row_split=rank2['Regulation'],row_split_gap=0.8,
                        col_split=2,col_split_gap=0.8,
                        tree_kws={'col_cmap': 'Set1'}, xticklabels_kws={'labelrotation':-45,'labelcolor':'blue'}
                       )
# you can add row_split if you want: uncomment it.


# print(cm.row_order)
# print(cm.col_order)
plt.savefig("heatmap.pdf",bbox_inches='tight')
plt.show()
            Regulation
ADAM7        Up
C8orf34-AS1  Up
SMIM28       Up
LINC01114    Up
KLK3         Up
...          ..
TRAJ45       Down
TPMTP1       Down
OPCML-IT1    Down
HNRNPCP4     Down
MAGEB1       Down

[89 rows x 1 columns]
ADAM7          ADAM7
C8orf34-AS1    None
SMIM28         None
LINC01114      None
KLK3           None
               ...
TRAJ45         None
TPMTP1         None
OPCML-IT1      OPCML-IT1
HNRNPCP4       None
MAGEB1         MAGEB1
Length: 89, dtype: object
(89, 16)
Starting plotting..
Starting calculating row orders..
Reordering rows..
Starting calculating col orders..
Reordering cols..
Plotting matrix..
Collecting legends..
Plotting legends..