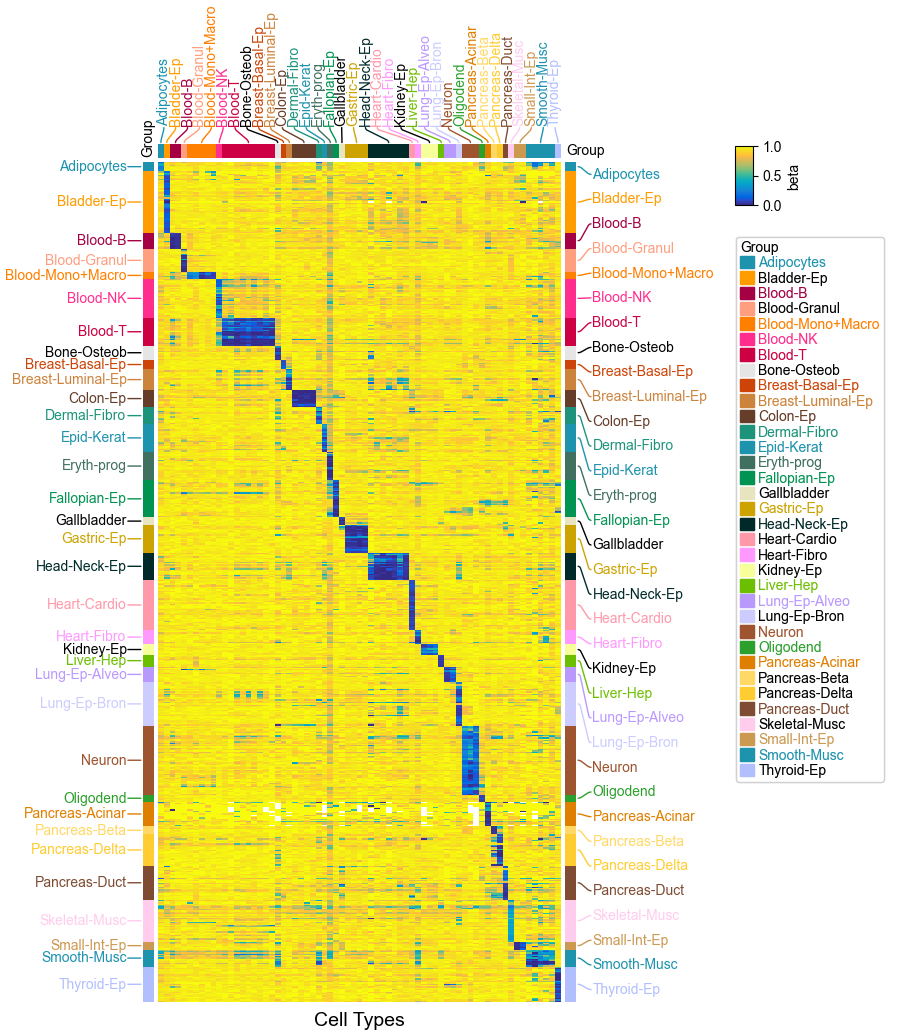
Visualizing Single Cell DNA Methylation Data (Loyfer2023)
[1]:
import os,sys
%matplotlib inline
import matplotlib.pylab as plt
import pickle
plt.rcParams['figure.dpi'] = 100
plt.rcParams['savefig.dpi']=300
plt.rcParams['font.family']='sans serif'
plt.rcParams['font.sans-serif']='Arial'
plt.rcParams['pdf.fonttype']=42
# sys.path.append(os.path.expanduser("~/Projects/Github/PyComplexHeatmap/"))
from PyComplexHeatmap import (
    ClusterMapPlotter,HeatmapAnnotation,anno_simple,
    anno_label,use_pch_style
)
use_pch_style() # or plt.style.use('default') to restore default style
Read Loyfer2023 DNA methylation dataset (cell types level for cell type methylation signatures) Loyfer2023 DNA methylation dataset comes from PMID: 36599988
[2]:
data=pd.read_csv("https://raw.githubusercontent.com/DingWB/PyComplexHeatmap/main/data/Loyfer2023.meth.csv",sep='\t',index_col=0)
df_row=pd.read_csv("https://raw.githubusercontent.com/DingWB/PyComplexHeatmap/main/data/Loyfer2023.meth.rows.csv",sep='\t',index_col=0)
df_col=pd.read_csv("https://raw.githubusercontent.com/DingWB/PyComplexHeatmap/main/data/Loyfer2023.meth.cols.csv",sep='\t',index_col=0)
[3]:
data.head()
[3]:
| Adipocytes | Bladder-Epithelium | Blood-B-Mem | Blood-B | Blood-Granulocytes | Colon-Macrophages | Liver-Macrophages | Blood-Monocytes | Lung-Interstitial-Macrophages | Lung-Alveolar-Macrophages | ... | Pancreas-Duct | Skeletal-Muscle | Small-int-Epithelium | Small-int-Endocrine | Lung-Bronchus-Smooth-Muscle | Prostate-Smooth-Muscle | Bladder-Smooth-Muscle | Coronary-Artery-Smooth-Muscle | Aorta-Smooth-Muscle | Thyroid-Epithelium | |
|---|---|---|---|---|---|---|---|---|---|---|---|---|---|---|---|---|---|---|---|---|---|
| chr1-110426397 | 0.120667 | 0.9102 | 0.8285 | 0.918667 | 0.750667 | 0.8705 | 0.896 | 0.916333 | 0.953333 | 0.9450 | ... | 0.61225 | 0.5485 | 0.94175 | 0.952 | 0.417 | 0.150 | 0.229 | 0.294 | 0.214 | 0.938333 |
| chr1-110426639 | 0.420000 | 0.9304 | 0.8920 | 0.955667 | 0.964667 | 0.9285 | 0.903 | 0.924667 | 0.975333 | 0.9720 | ... | 0.94575 | 0.8990 | 0.96225 | 0.963 | 0.606 | 0.185 | 0.348 | 0.917 | 0.484 | 0.972333 |
| chr1-110426659 | 0.425667 | 0.9328 | 0.7635 | 0.933000 | 0.942333 | 0.8945 | 0.931 | 0.963667 | 0.899333 | 0.8895 | ... | 0.93875 | 0.8390 | 0.92225 | 0.903 | 0.559 | 0.129 | 0.292 | 0.875 | 0.395 | 0.989667 |
| chr1-110427109 | 0.203667 | 0.9724 | 0.9610 | 0.963667 | 0.968667 | 0.9240 | 0.939 | 0.985000 | 0.968667 | 0.9620 | ... | 0.73300 | 0.7570 | 0.96525 | 0.939 | 0.929 | 0.225 | 0.806 | 0.951 | 0.905 | 0.974333 |
| chr1-110427116 | 0.217333 | 0.9478 | 1.0000 | 0.976000 | 0.970667 | 0.9730 | 0.913 | 0.975000 | 0.970333 | 0.9800 | ... | 0.65125 | 0.7955 | 0.96150 | 1.000 | 0.952 | 0.605 | 0.857 | 1.000 | 0.868 | 0.981000 |
5 rows × 69 columns
[4]:
df_row.head()
[4]:
| Group | |
|---|---|
| ID | |
| chr1-110426397 | Adipocytes |
| chr1-110426639 | Adipocytes |
| chr1-110426659 | Adipocytes |
| chr1-110427109 | Adipocytes |
| chr1-110427116 | Adipocytes |
[5]:
df_col.head()
[5]:
| Group | |
|---|---|
| ClusterID | |
| Adipocytes | Adipocytes |
| Bladder-Epithelium | Bladder-Ep |
| Blood-B-Mem | Blood-B |
| Blood-B | Blood-B |
| Blood-Granulocytes | Blood-Granul |
[6]:
df_col.Group.unique()
[6]:
array(['Adipocytes', 'Bladder-Ep', 'Blood-B', 'Blood-Granul',
       'Blood-Mono+Macro', 'Blood-NK', 'Blood-T', 'Bone-Osteob',
       'Breast-Basal-Ep', 'Breast-Luminal-Ep', 'Colon-Ep', 'Dermal-Fibro',
       'Epid-Kerat', 'Eryth-prog', 'Fallopian-Ep', 'Gallbladder',
       'Gastric-Ep', 'Head-Neck-Ep', 'Heart-Cardio', 'Heart-Fibro',
       'Kidney-Ep', 'Liver-Hep', 'Lung-Ep-Alveo', 'Lung-Ep-Bron',
       'Neuron', 'Oligodend', 'Pancreas-Acinar', 'Pancreas-Beta',
       'Pancreas-Delta', 'Pancreas-Duct', 'Skeletal-Musc', 'Small-Int-Ep',
       'Smooth-Musc', 'Thyroid-Ep'], dtype=object)
[7]:
col_colors_dict={
                'Adipocytes':'#1E93AE','Bladder-Ep':'#FF9C00','Blood-B':'#A40043','Blood-Granul':'#FF9F7F',
                'Blood-Mono+Macro':'#FF7F00','Blood-NK':'#FF2E8D','Blood-T':'#CC0043','Bone-Osteob':'#E5E5E5',
                'Breast-Basal-Ep':'#CC4407','Breast-Luminal-Ep':'#CC843D','Colon-Ep':'#663D28','Dermal-Fibro':'#1E937C',
                'Epid-Kerat':'#1E93AE','Eryth-prog':'#40705F','Fallopian-Ep':'#009351','Gallbladder':'#E7E4BF',
                'Gastric-Ep':'#CCA300','Head-Neck-Ep':'#002929','Heart-Cardio':'#FF99AA','Heart-Fibro':'#FF99FF',
                'Kidney-Ep':'#F6FF99','Liver-Hep':'#6CBF00','Lung-Ep-Alveo':'#BA99FF','Lung-Ep-Bron':'#CCCCFF',
                'Neuron':'#9e542e','Oligodend':'#2ca02c','Pancreas-Acinar':'#DF7F00','Pancreas-Beta':'#FFD866',
                'Pancreas-Delta':'#FFCC32','Pancreas-Duct':'#7F4C33','Skeletal-Musc':'#FFCCEE','Small-Int-Ep':'#CC9951',
                'Smooth-Musc':'#1E93AE','Thyroid-Ep':'#B2BFFF'}

col_ha = HeatmapAnnotation(label=anno_label(df_col['Group'],merge=True,rotation=90,extend=True,
                                            colors=col_colors_dict,adjust_color=True,luminance=0.75,
                                            relpos=(0.5,0)), #fontsize=10
                           Group=anno_simple(df_col['Group'],colors=col_colors_dict), #legend_kws={'fontsize':4}
                           verbose=1,axis=1)
left_ha = HeatmapAnnotation(
                          label=anno_label(df_row['Group'],merge=True,extend=False,
                                            colors=col_ha.annotations[1].color_dict,adjust_color=True,luminance=0.75,
                                              relpos=(1,0.5)),
                           Group=anno_simple(df_row['Group'],legend=True,
                                             colors=col_ha.annotations[1].color_dict),
                           verbose=1,axis=0,plot_legend=False)
right_ha = HeatmapAnnotation(
                           Group=anno_simple(df_row['Group'],legend=True,
                                             colors=col_ha.annotations[1].color_dict),
                           label=anno_label(df_row['Group'],merge=True,extend=True,
                                            colors=col_ha.annotations[1].color_dict,adjust_color=True,luminance=0.75,
                                            relpos=(0,0.5)), #fontsize=10
                           verbose=1,axis=0,plot_legend=False,label_kws=dict(visible=False))

#data was sorted to have the same Group order for rows and columns
# df_row.sort_values('Group',inplace=True)
# df_col.sort_values('Group',inplace=True)
plt.figure(figsize=(6, 10))
cm = ClusterMapPlotter(data=data.loc[df_row.index.tolist(),df_col.index.tolist()],
                       top_annotation=col_ha, left_annotation=left_ha,
                       right_annotation=right_ha,
                       row_cluster=False,col_cluster=False,
                       label='beta', row_dendrogram=False,legend_vgap=7,
                       # row_split=df_row.Group,col_split=df_col.Group,
                       # row_split_gap=0.2,col_split_gap=0.1
                       # row_split_order=df_row.Group.unique().tolist(),
                       # col_split_order=df_row.Group.unique().tolist(),
                       cmap='parula',rasterized=True,
                       xlabel="Cell Types", legend_hpad=0,
                       # ylabel="CpGs",
                       xlabel_kws=dict(color='black', fontsize=14, labelpad=0),
                       # ylabel_kws=dict(color='black', fontsize=14, labelpad=0),
                          )
plt.savefig("Loyfer2023_heatmap.pdf",bbox_inches='tight')
plt.show()
Starting..
Calculating row orders..
Reordering rows..
Calculating col orders..
Reordering cols..
Plotting matrix..
Plotting HeatmapAnnotations
Plotting HeatmapAnnotations
Plotting HeatmapAnnotations
Collecting legends..
Collecting annotation legends..
Collecting annotation legends..
Collecting annotation legends..
Plotting legends..
Estimated legend width: 41.981944444444444 mm