Visualizing gene set enrichment analysis results (clusterProfiler) using dotHeatmap
[1]:
import os,sys
import matplotlib.pylab as plt
import pickle
import glob
import numpy as np
import matplotlib as mpl
import pandas as pd
mpl.style.use('default')
mpl.rcParams['pdf.fonttype'] = 42
mpl.rcParams['ps.fonttype'] = 42
mpl.rcParams['font.family'] = 'sans-serif'
mpl.rcParams['font.sans-serif'] = 'Arial'
mpl.rcParams['figure.dpi'] = 80
mpl.rcParams['savefig.dpi']=300
import pickle
sys.path.append(os.path.expanduser("~/Projects/Github/PyComplexHeatmap"))
from PyComplexHeatmap import (
    ClusterMapPlotter,DotClustermapPlotter,HeatmapAnnotation,anno_simple,anno_scatterplot,anno_lineplot,anno_barplot,
    anno_label,anno_boxplot,anno_img,
)
Why do we need a better way to visualize the gene set enrichment analysis result?
Traditionally, we have to plot lots of barplot or dotplot to visualize the gene set enrichment analysis. For example:


What if we had lots of cell types and performed gene set enrichment analysis for each cell types? It is not a good idea to plot lots of barplot or dotplot in the manuscript.
In this case, we can merge all the enriched result into one matrix and plot a dotHeatmap using PyComplexHeatmap
Read data
In this example dataset, we have 2 groups and 3 different cell types in each group, and we have already gotten the GO Biological Process (BP), Molecular Function (MF) and KEGG Pathway enrichment result using R package clusterProfiler and merged the results into one matrix.
[2]:
with open("../data/enrichment_analysis_dotHeatmap.pickle",'rb') as f:
    data1,df_row,df_col,colors=pickle.load(f)
[3]:
data1
[3]:
| ID | Description | GeneRatio | p.adjust | Count | Group | CellType | EnrichedCategory | -log10(p.adjust) | ColID | RowID | |
|---|---|---|---|---|---|---|---|---|---|---|---|
| 0 | GO:0003779 | actin binding | 0.044949 | 2.453212e-41 | 186 | Group2 | CT1 | MF | 40.610265 | Group2-CT1 | MF||actin binding |
| 1 | GO:0030695 | GTPase regulator activity | 0.043016 | 6.744023e-40 | 178 | Group2 | CT1 | MF | 39.171081 | Group2-CT1 | MF||GTPase regulator activity |
| 2 | GO:0060589 | nucleoside-triphosphatase regulator activity | 0.043016 | 6.744023e-40 | 178 | Group2 | CT1 | MF | 39.171081 | Group2-CT1 | MF||nucleoside-triphosphatase regulator activity |
| 3 | GO:0005201 | extracellular matrix structural constituent | 0.021266 | 5.810239e-35 | 88 | Group2 | CT1 | MF | 34.235806 | Group2-CT1 | MF||extracellular matrix structural constituent |
| 4 | GO:0050839 | cell adhesion molecule binding | 0.031899 | 1.612420e-31 | 132 | Group2 | CT1 | MF | 30.792522 | Group2-CT1 | MF||cell adhesion molecule binding |
| ... | ... | ... | ... | ... | ... | ... | ... | ... | ... | ... | ... |
| 840 | GO:0050905 | neuromuscular process | 0.010454 | 1.224335e-07 | 122 | Group2 | CT2 | BP | 6.912100 | Group2-CT2 | BP||neuromuscular process |
| 1205 | GO:0030534 | adult behavior | 0.009426 | 6.028861e-06 | 110 | Group2 | CT2 | BP | 5.219765 | Group2-CT2 | BP||adult behavior |
| 1558 | GO:0035019 | somatic stem cell population maintenance | 0.004799 | 6.029991e-05 | 56 | Group2 | CT2 | BP | 4.219683 | Group2-CT2 | BP||somatic stem cell population maintenance |
| 1746 | GO:0019827 | stem cell population maintenance | 0.009854 | 1.467128e-04 | 115 | Group2 | CT2 | BP | 3.833532 | Group2-CT2 | BP||stem cell population maintenance |
| 2999 | GO:0021953 | central nervous system neuron differentiation | 0.008997 | 9.138960e-03 | 105 | Group2 | CT2 | BP | 2.039103 | Group2-CT2 | BP||central nervous system neuron differentiation |
139 rows × 11 columns
[4]:
df_row
[4]:
| EnrichedCategory | Description | |
|---|---|---|
| RowID | ||
| MF||actin binding | MF | actin binding |
| MF||GTPase regulator activity | MF | GTPase regulator activity |
| MF||nucleoside-triphosphatase regulator activity | MF | nucleoside-triphosphatase regulator activity |
| MF||extracellular matrix structural constituent | MF | extracellular matrix structural constituent |
| MF||cell adhesion molecule binding | MF | cell adhesion molecule binding |
| MF||metal ion transmembrane transporter activity | MF | metal ion transmembrane transporter activity |
| MF||monoatomic ion channel activity | MF | monoatomic ion channel activity |
| MF||monoatomic ion gated channel activity | MF | monoatomic ion gated channel activity |
| MF||gated channel activity | MF | gated channel activity |
| MF||calmodulin binding | MF | calmodulin binding |
| MF||transmembrane receptor protein kinase activity | MF | transmembrane receptor protein kinase activity |
| BP||cell-substrate adhesion | BP | cell-substrate adhesion |
| BP||extracellular structure organization | BP | extracellular structure organization |
| BP||extracellular matrix organization | BP | extracellular matrix organization |
| BP||external encapsulating structure organization | BP | external encapsulating structure organization |
| BP||axon guidance | BP | axon guidance |
| BP||locomotory behavior | BP | locomotory behavior |
| BP||adult behavior | BP | adult behavior |
| BP||fat cell differentiation | BP | fat cell differentiation |
| BP||neuromuscular process | BP | neuromuscular process |
| BP||central nervous system neuron differentiation | BP | central nervous system neuron differentiation |
| BP||central nervous system neuron development | BP | central nervous system neuron development |
| BP||stem cell population maintenance | BP | stem cell population maintenance |
| BP||somatic stem cell population maintenance | BP | somatic stem cell population maintenance |
| KEGG||Amphetamine addiction | KEGG | Amphetamine addiction |
| KEGG||Calcium signaling pathway | KEGG | Calcium signaling pathway |
| KEGG||Cocaine addiction | KEGG | Cocaine addiction |
| MF||cytokine activity | MF | cytokine activity |
| KEGG||Cytokine-cytokine receptor interaction | KEGG | Cytokine-cytokine receptor interaction |
| KEGG||Neuroactive ligand-receptor interaction | KEGG | Neuroactive ligand-receptor interaction |
| KEGG||Cytoskeleton in muscle cells | KEGG | Cytoskeleton in muscle cells |
| KEGG||ECM-receptor interaction | KEGG | ECM-receptor interaction |
| KEGG||Viral protein interaction with cytokine and cytokine receptor | KEGG | Viral protein interaction with cytokine and cy... |
| KEGG||Focal adhesion | KEGG | Focal adhesion |
| KEGG||Axon guidance | KEGG | Axon guidance |
| KEGG||Systemic lupus erythematosus | KEGG | Systemic lupus erythematosus |
| KEGG||ATP-dependent chromatin remodeling | KEGG | ATP-dependent chromatin remodeling |
| MF||methylation-dependent protein binding | MF | methylation-dependent protein binding |
| MF||methylated histone binding | MF | methylated histone binding |
| MF||modification-dependent protein binding | MF | modification-dependent protein binding |
[5]:
df_col
[5]:
| Group | CellType | |
|---|---|---|
| Group2-CT1 | Group2 | CT1 |
| Group1-CT2 | Group1 | CT2 |
| Group1-CT3 | Group1 | CT3 |
| Group2-CT3 | Group2 | CT3 |
| Group1-CT4 | Group1 | CT4 |
| Group1-CT1 | Group1 | CT1 |
| Group2-CT2 | Group2 | CT2 |
Plot
[6]:
s_min,s_max=data1.GeneRatio.min(),data1.GeneRatio.max()
[7]:
data1.loc[data1.GeneRatio==s_min]
[7]:
| ID | Description | GeneRatio | p.adjust | Count | Group | CellType | EnrichedCategory | -log10(p.adjust) | ColID | RowID | |
|---|---|---|---|---|---|---|---|---|---|---|---|
| 3074 | GO:0021954 | central nervous system neuron development | 0.004586 | 0.027429 | 42 | Group2 | CT3 | BP | 1.561784 | Group2-CT3 | BP||central nervous system neuron development |
[8]:
data1.loc[data1.GeneRatio==s_max]
[8]:
| ID | Description | GeneRatio | p.adjust | Count | Group | CellType | EnrichedCategory | -log10(p.adjust) | ColID | RowID | |
|---|---|---|---|---|---|---|---|---|---|---|---|
| 1 | GO:0045444 | fat cell differentiation | 0.176471 | 0.000382 | 6 | Group1 | CT1 | BP | 3.417494 | Group1-CT1 | BP||fat cell differentiation |
[9]:
left_ha = HeatmapAnnotation(
                          label=anno_label(df_row.EnrichedCategory, merge=True,rotation=0,colors=colors,relpos=(1,0.8)),
                          Category=anno_simple(df_row.EnrichedCategory,cmap='Set1',
                                           add_text=False,legend=False,colors=colors),
                           axis=0,verbose=0,label_kws={'rotation':45,'horizontalalignment':'left','visible':False})
right_ha = HeatmapAnnotation(
                          label=anno_label(df_row.Description, merge=True,rotation=0,relpos=(0,0.5),arrowprops=dict(visible=True),
                                           colors=df_row.assign(color=df_row.EnrichedCategory.map(colors)).set_index('Description').color.to_dict(),
                                          fontsize=12,luminance=0.8,height=2),
                           axis=0,verbose=0,label_kws={'rotation':45,'horizontalalignment':'left'},
                            orientation='right')

col_ha = HeatmapAnnotation(
                           Group=anno_simple(df_col.Group,cmap='Set1',legend=False,add_text=True,
                                               height=4.5,colors={'Group1':'yellowgreen','Group2':'orange'}),
                           CellClass=anno_simple(df_col.CellType,cmap='Set1',legend=False,add_text=True,
                                                 height=4.5),
                           verbose=0,label_side='right',label_kws={'horizontalalignment':'left'})

plt.figure(figsize=(4, 8))
cm = DotClustermapPlotter(data=data1, x='ColID',y='RowID',value='-log10(p.adjust)',c='-log10(p.adjust)',s='GeneRatio',
                          row_cluster=True,col_cluster=True,hue='Group',
                          cmap={'Group1':'Greens','Group2':'OrRd'},
                          vmin=-1*np.log10(0.1),vmax=-1*np.log10(1e-10),
                          colors={'Group1':'yellowgreen','Group2':'orange'},
                          marker={'Group1':'*','Group2':'$\\ast$'},
                          show_rownames=True,show_colnames=False,row_dendrogram=False,
                          col_names_side='top',#row_names_side='right',
                          xticklabels_kws={'labelrotation': 30, 'labelcolor': 'blue','labelsize':14},
                          top_annotation=col_ha,left_annotation=left_ha,right_annotation=right_ha,
                          spines=False,
                          row_split=df_row.EnrichedCategory, row_split_gap=1,
                          col_split=df_col.Group,col_split_gap=0.5,
                          verbose=1,legend_vgap=8,
                          #dot_legend_marker='*',
                          # xlabel=Group,xlabel_side="top",
                          # xlabel_kws=dict(labelpad=8,fontweight='bold'),
                          # xlabel_bbox_kws=dict(facecolor=facecolor)
                         )
# cm.ax_heatmap.grid(which='minor',color='black',linestyle='--',linewidth=1)
# for ax in cm.heatmap_axes.ravel():
#     ax.grid(axis='both',which='minor',color='black',linestyle='dashdot',alpha=0.1) # which can also be set to major
    # for side in ["top", "left", "bottom"]: # to show the spines
    #     ax.spines[side].set_visible(True)
    #     ax.spines[side].set_color('grey')
    #     ax.spines[side].set_linewidth(1)
    #     ax.spines[side].set_linestyle('--')
# plt.savefig(f"cell_class_dotHeatmap.pdf",bbox_inches='tight')
plt.show()
Starting..
Calculating row orders..
Reordering rows..
Calculating col orders..
Reordering cols..
Plotting matrix..
Inferred max_s (max size of scatter point) is: 106.46754159267321
Collecting legends..
Plotting legends..
Estimated legend width: 23.6375 mm
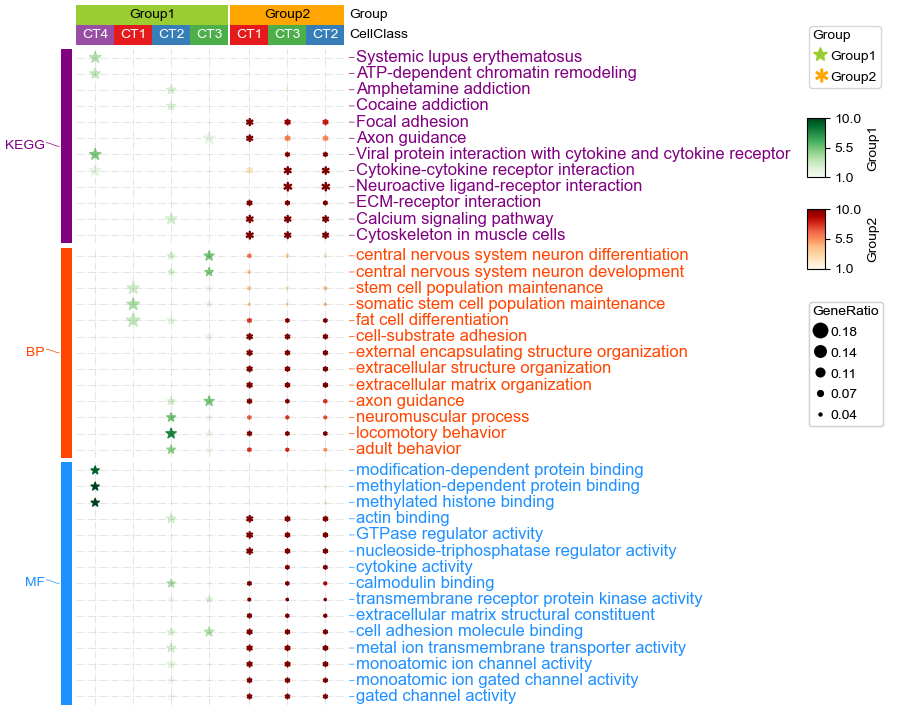
In this example, we used two different kinds of markers and cmap to indicate Group1 and Group2, rows are split by category of enriched terms, sizes of dot/marker indicates gene ratio (The ratio of genes annotated by the GO term in your list to the total number of genes in your list).
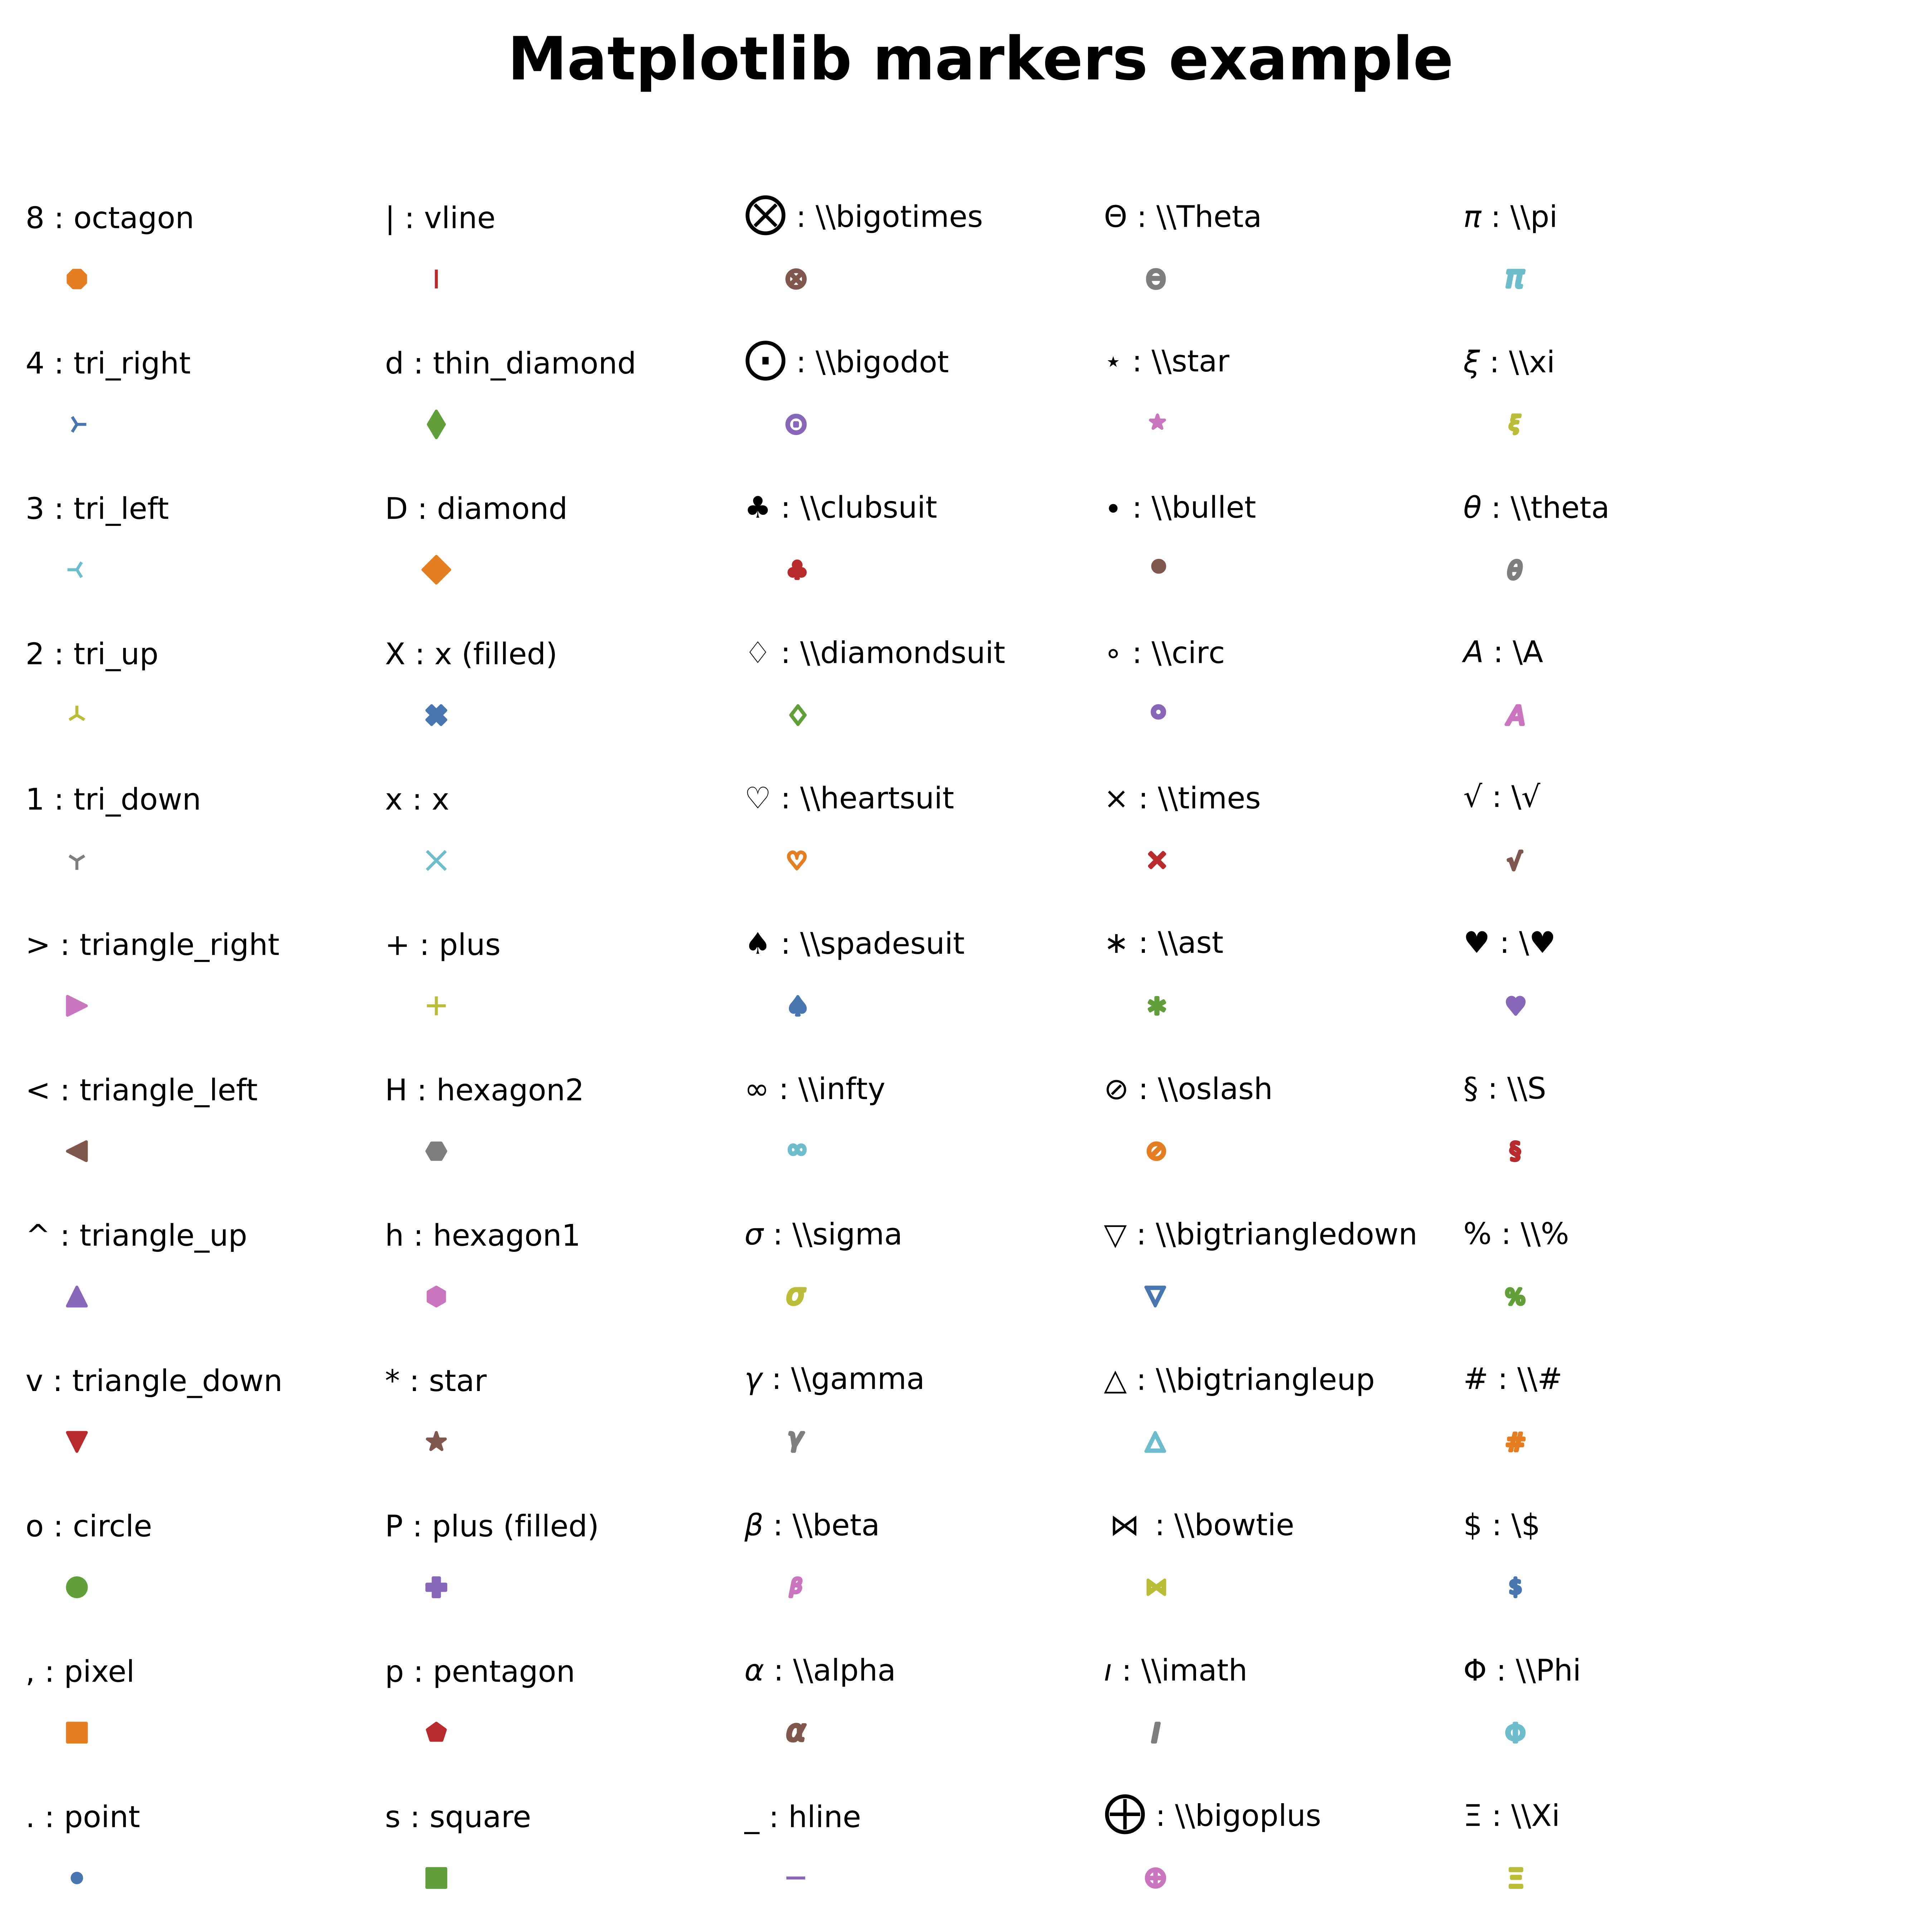
How to select marker: