Visualizing categorical variables using oncoPrint
[1]:
import os,sys
import matplotlib.pylab as plt
# sys.path.append(os.path.expanduser("~/Projects/Github/PyComplexHeatmap/"))
from PyComplexHeatmap import (
    oncoPrintPlotter,HeatmapAnnotation,anno_simple,anno_scatterplot,anno_lineplot,anno_barplot,
    anno_label,anno_boxplot,anno_img,use_pch_style
)
from PyComplexHeatmap.utils import despine
use_pch_style() # or plt.style.use('default') to restore default style
import pandas as pd
import random
[2]:
# Create toy dataset
samples = [f'Sample_{i}' for i in range(1, 11)]
genes = [f'Gene_{i}' for i in range(1, 11)]

alts_lol = list()

for sample in samples:
    for gene in genes:
        amp_value = random.randint(0, 1)

        if amp_value == 0:
            del_value = random.randint(0, 1)

        else:
            del_value = 0

        if (amp_value == 0) & (del_value == 0):
            neut_value = 1

        else:
            neut_value = 0

        alts_lol.append([sample, gene, amp_value, neut_value, del_value])

alts_df = pd.DataFrame(alts_lol, columns=['sample', 'gene', 'amp', 'neut', 'del'])

# Prepare column annotations
annot_1_df = pd.DataFrame([[i, random.randint(0,100)] for i in samples], columns=['sample', 'annot1'])
annot_1_df.index = annot_1_df['sample']

annot_2_df = pd.DataFrame([[i, random.randint(500, 5000)] for i in samples], columns=['sample', 'annot2'])
annot_2_df.index = annot_2_df['sample']

annot_3_df = pd.DataFrame([[i, 'patient' + str(random.randint(1,5))] for i in samples],
                            columns=['sample', 'patient'])
annot_3_df.index = annot_3_df['sample']
[3]:
alts_df
[3]:
| sample | gene | amp | neut | del | |
|---|---|---|---|---|---|
| 0 | Sample_1 | Gene_1 | 1 | 0 | 0 |
| 1 | Sample_1 | Gene_2 | 0 | 1 | 0 |
| 2 | Sample_1 | Gene_3 | 1 | 0 | 0 |
| 3 | Sample_1 | Gene_4 | 1 | 0 | 0 |
| 4 | Sample_1 | Gene_5 | 0 | 0 | 1 |
| ... | ... | ... | ... | ... | ... |
| 95 | Sample_10 | Gene_6 | 1 | 0 | 0 |
| 96 | Sample_10 | Gene_7 | 0 | 1 | 0 |
| 97 | Sample_10 | Gene_8 | 0 | 1 | 0 |
| 98 | Sample_10 | Gene_9 | 1 | 0 | 0 |
| 99 | Sample_10 | Gene_10 | 1 | 0 | 0 |
100 rows × 5 columns
[4]:
annot_3_df
[4]:
| sample | patient | |
|---|---|---|
| sample | ||
| Sample_1 | Sample_1 | patient2 |
| Sample_2 | Sample_2 | patient1 |
| Sample_3 | Sample_3 | patient3 |
| Sample_4 | Sample_4 | patient5 |
| Sample_5 | Sample_5 | patient4 |
| Sample_6 | Sample_6 | patient3 |
| Sample_7 | Sample_7 | patient4 |
| Sample_8 | Sample_8 | patient5 |
| Sample_9 | Sample_9 | patient1 |
| Sample_10 | Sample_10 | patient3 |
[5]:
annot_1_df
[5]:
| sample | annot1 | |
|---|---|---|
| sample | ||
| Sample_1 | Sample_1 | 51 |
| Sample_2 | Sample_2 | 42 |
| Sample_3 | Sample_3 | 4 |
| Sample_4 | Sample_4 | 72 |
| Sample_5 | Sample_5 | 92 |
| Sample_6 | Sample_6 | 26 |
| Sample_7 | Sample_7 | 96 |
| Sample_8 | Sample_8 | 80 |
| Sample_9 | Sample_9 | 68 |
| Sample_10 | Sample_10 | 97 |
[6]:
annot_2_df
[6]:
| sample | annot2 | |
|---|---|---|
| sample | ||
| Sample_1 | Sample_1 | 2459 |
| Sample_2 | Sample_2 | 4938 |
| Sample_3 | Sample_3 | 1993 |
| Sample_4 | Sample_4 | 4286 |
| Sample_5 | Sample_5 | 2492 |
| Sample_6 | Sample_6 | 3222 |
| Sample_7 | Sample_7 | 1677 |
| Sample_8 | Sample_8 | 589 |
| Sample_9 | Sample_9 | 3727 |
| Sample_10 | Sample_10 | 4144 |
[7]:
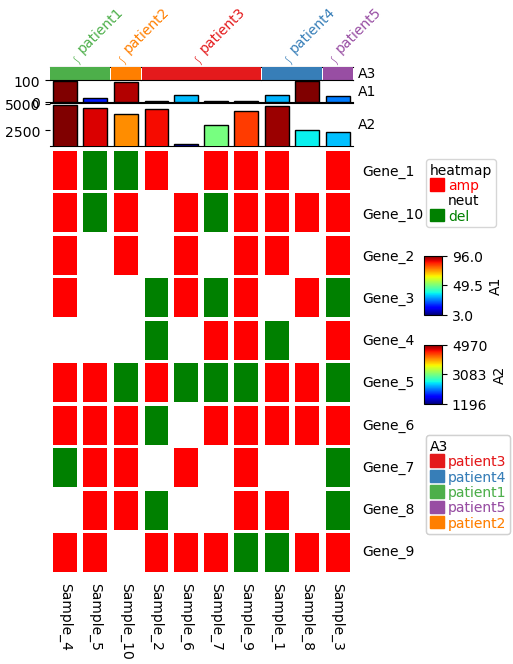
top_annotation=HeatmapAnnotation(label=anno_label(annot_3_df.patient, merge=True,rotation=45),
                                 A3=anno_simple(annot_3_df['patient']),
                                 A1=anno_barplot(annot_1_df['annot1'],height=5),
                                 A2=anno_barplot(annot_2_df['annot2']))

# Plot oncoprint
plt.figure(figsize=(4,6))

op=oncoPrintPlotter(data=alts_df, y='gene', x='sample', values=['amp', 'neut', 'del'],
                    show_rownames=True, show_colnames=True, colors=['red', 'white', 'green'],
                    top_annotation=top_annotation, col_split=annot_3_df['patient'],
                    col_split_gap=0.2,width=0.8)
#width control the width of the bar in each cell
# there are other plot_kws, such as 'align'

# Remove the grid
# for annotation in op.top_annotation.annotations:
#     ax=annotation.ax
#     ax.grid(False)
#     #remove spines for top annotation and right annotation
#     despine(ax=ax,left=False, bottom=True, right=False, top=True)
#     despine(ax=ax,left=True, bottom=False, right=True, top=False)

# Remove the grid
for ax in op.top_annotation.axes.flatten():
    ax.grid(False)
    #remove spines for top annotation and right annotation
    despine(ax=ax,left=False, bottom=True, right=False, top=True)
    despine(ax=ax,left=True, bottom=False, right=True, top=False)
Starting..
Calculating row orders..
Reordering rows..
Calculating col orders..
Reordering cols..
Plotting matrix..
Plotting HeatmapAnnotations
Collecting legends..
Collecting annotation legends..
Plotting legends..
Estimated legend width: 21.344444444444445 mm